I’m an avid Strava user however I won’t buy Strava Premium. Why? Because there are already loads of analysis tools out there that integrate with Strava and offer loads of geeky tools and pretty graphs to play with. I can’t think of any analysis that Strava premium might be able to offer me that I can’t already do for free. This is a list of 5 tools (+1 extra) that I use to better visualise the data recorded and stored by Strava.
Firstly, I’ll note that I’m very much aware that behind (almost) every website is a business that is out there to make money, and Strava is no exception. All large websites have bills to pay; servers, staff and hosting events all cost money, so I see why they need people to subscribe to premium. In fact, I thank all those who do pay for the service because in doing so you make it possible for me to use Strava for free! What I’m not ok with, is Strava forcing premium upon users e.g. ‘try-me for 30 days’, or ‘Joe just got premium, join him now.’ There’s even a little icon next to your notifications that is always there to tempt you! I’m not 100% sure what extra perks you get with Strava Premium. What I do know is that you should be made aware of these 6 tools and how they can enhance your analysis before you commit to purchasing premium.
This is not a comprehensive list, it is just the tools that I use and have come across through various means (word of mouth, blogs, twitter etc…). You could interpret it as a little payback to the community, where I’ve gather what I think is good and now I’m sharing it with you. I hope there’s something here that you’ve never heard of before and it improves your sporting analysis experience.
Activity Playback (Strava Labs)

This is a really cool little tool which I use every so often when I pass someone I know, or indeed someone I don’t and I’m interested in the route they rode. You simply pop in your Strava ride url and it shows your route overlaid with all the other Strava riders who rode routes which either crossed your path or came close. Will Barr gave me the link to this one; here’s a sample ride of me and him passing close to each other so you can see what I mean. I sometimes have a play around with this when there’s loads of groups going in different directions on a club ride. It can be a bit mesmerising to watch. You’ve been warned!
Strava Multiple Ride Mapper

This is another fascinating one. You’ve probably seen a general heatmap before, but have you seen one comprising of just your rides/runs? Using the ‘low detail’ option plots much quicker and gives you a good overview of where you’ve ridden before (best for people with 200+ activities to map). Or if you really can’t deal with losing the detail, pick ‘high detail’ and you’ll get all your routes as they would appear on Strava, but now they’re all overlaid on one map with appropriate ‘heat’ for the routes most travelled upon.
Global Heatmap (Strava Labs)
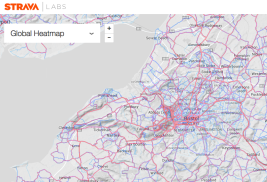
So you’ve mapped where you’ve been with the multiple ride mapper, but what about if you just want to see what the most popular routes are? This global heatmap gives you a great overview. I find it comes in handy when plotting new routes and I’m unsure whether a road will be suitable for a road bike. Just have a quick check on the heatmap to see what sort of frequency it’s been ride to give you an idea of whether it’s worth adding to the route. If no one else has ridden it before, i.e. there’s no heat, it’s probably best to steer clear.
Annual Summary (loads of data!)

The big numbers! There are two options for viewing a summary of all your activities displayed in all manner of tables and graphs. My faithful tool of choice for the last year or so has been jpo’s annual summary. This has enough detail with plenty of graphs and tables to pour over for hours; right up my street. Veloviewer delivers a slightly more in-your-face ‘US style’ (albeit UK based) summary with more stuff to play around with. Unfortunately this is limited to 25 activities, beyond which you can pay to go Pro… Boo! This is all about the free stuff! Still, it might be worth a check if you want to analyse a really good month or something like that. That being said, I’d still go with jonathanokeefe‘s annual summary.


Segment Details
Another Strava tool from jpo that I hadn’t used until I decided to write this is the Segment Details tool. If the other tools were a bit nerdy, this is the pinnacle of ‘Strava Nerd’. It allows you to analyse the podium of segments, see all the efforts ever made and loads more. I imagine this could get quite demoralising over time. ![]()
 *This is pretty much my only KOM and I’d forgotten about the little Strava scrap to secure that top spot 😉
Plot a Route
Finally, this isn’t a Strava app, but it’s a cool surprisingly helpful tool to get you out of the habit of doing the same old routes over and over. Sometimes it’s difficult to be creative, Plotaroute helps you out by using the ‘Make me a route’ option. You can select a distance and either go in a loop or from point A to B, and it will plot around 10 options for you to try. Have a flick through and ride/run whatever route takes your fancy. The advanced option also allows you to select your preferred terrain e.g. hills or ‘flat as possible’ (quite handy around Bristol).

